HOW TO ANALYZE MAINTENANCE RECORD OF YOUR CAR
Aug 22, 2016 learning phys-492/592
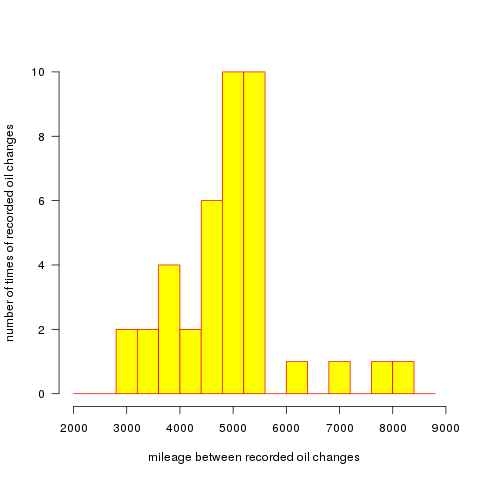
I bought a second handed car last year. The dealer showed me a long maintenance record from CARFAX and claimed that the car was very well served. Well, by simply looking at all the oil change records I would have to agree with him. However, I made a simple spreadsheet and generated the histogram above and realized immediately that the car was nothing more than being regularly maintained.
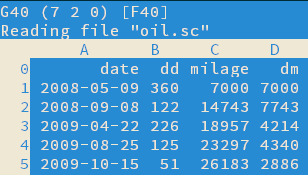
The spreadsheet was created with a command-line tool sc. The following screenshot shows part of it. The last column shows the mileage increase between two oil changes. The histogram shows the statistic distribution of it.
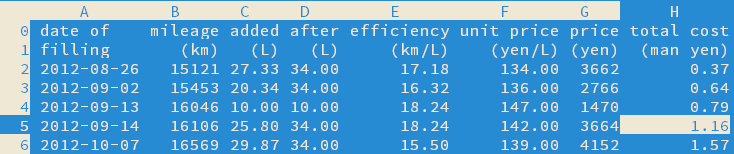
What else can we plot out of a nice maintenance record? I recorded the amount of fuel I added each time and the mileage when I added fuel for a mini jeep when I was in Japan. The following spreadsheet shows part of the record:
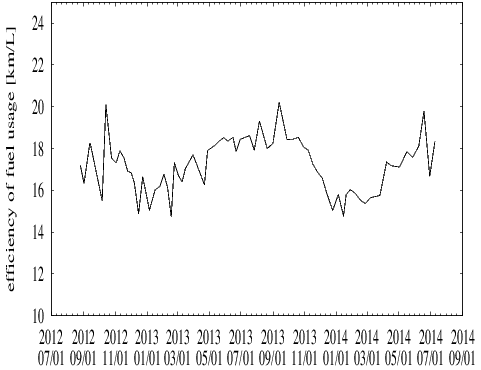
The fuel efficiency (how many kilometer the car can run by consuming 1 L of gas) versus the date as shown in the plot below shows clearly an annual modulation of the efficiency. In winter the efficiency drops because of heavy snow in the town where I lived in Japan.
All the data and analysis codes are available in
You will need the following program to run the codes:
Activities mentions in this site have been supported by the following grants: