ROOT AS FUNCTION PLOTTER
Sep 08, 2016 learning ROOT phys-492/592
If you know how to use PuTTY to log into a remote Linux server from any Windows PC and run an X-Window server in your Windows PC, you will be able to use ROOT as a function plotter, as described in the ROOT primer:
ROOT [0] TF1 *f1 = new TF1("f1", "sin(x)/x", 0.,10.);
ROOT [1] f1->Draw();
The ROOT primer explains the meaning of each terms nicely. If you do not quite understand the concept of class in C++, please read this post first. The contents in the second pair of quotes is actually the math expression of the function. For a complete list of all available math expressions that is acceptable in the second pair of quotes, please refer to the class reference web page of TFormula, which is a ROOT class that actually handles the math expression.
The results would look like the following screen shot:
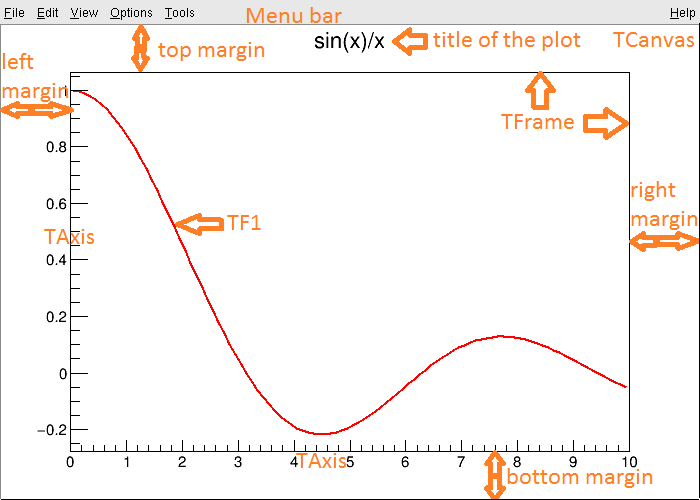
The default window has a menu bar on top and a canvas below, where the function is drawn in a frame with x and y axes. The plot has a title. There are margins between the frame and the border of the canvas.
It is wired to see most of the words start with a T, such TCanvas, TFrame, etc. They are ROOT class names. All ROOT classes are named this way. Some people insist that they should have been named ROOT::Canvas, ROOT::Frame instead, where ROOT is a namespace where all classes exist. Practically, this does not affect functionality at all and does not matter that much for a beginner.
TF1 is of course another ROOT class. Most classes in ROOT are nicely documented online. Search on Google “ROOT TF1” would take you there.
You may notice that the range of the x axis is exactly the same as you specified in the code, from 0 to 10. The range of y axis is automatically chosen so that the function can be nicely contained in the frame.
This window is highly interactive. Try to use your mouse to resize the frame and title, drag them around. Right clicks on margin, frame, red curve, axes bring up a rich list of actions to change the behavior and appearance of the plot. Drag your mouse from one number to another on both axes and you will be able to zoom into that specific region.
Click on View in the menu bar, enable Editor and Event Statusbar and you will see something like this:
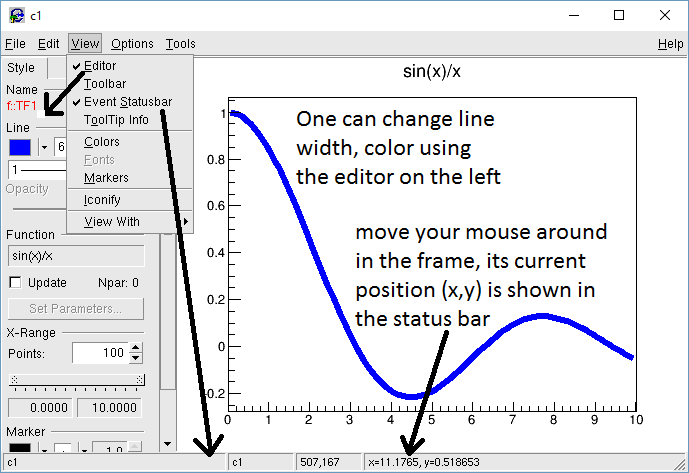
The contents of the Editor side bar change when you click on different things on canvas. Left click on the function curve, the Editor should show settings of TF1, where you can change the line width and color of the curve, etc.
The status bar shows the current location of your mouse in the frame. This is very useful for you to obtain the x,y coordinates of an arbitrary point in the function.
When you quit ROOT and draw a canvas again, the status bar is gone. The setting through the menu bar is not persistent. In order to enable the status bar permanently, you have to use the configuration file for ROOT: ~/.rootrc. Use your favorite text editor to open or create this file, for example:
$ emacs ~/.rootrc &
Add the following line to the file, save and quit and you are done:
Canvas.ShowEventStatus: true
The default settings of ROOT are saved in /etc/system.rootrc or $ROOTSYS/etc/system.rootrc. They can be overwritten by your personal settings specified in ~/.rootrc.
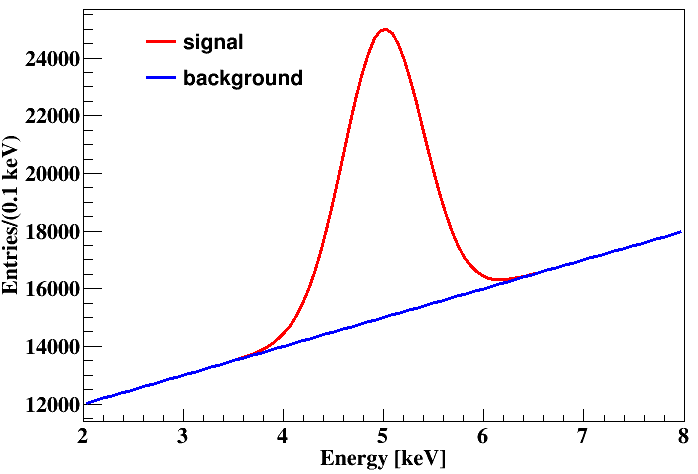
Most of the settings that you can change using the GUI editor can be changed using C++ codes as well. Here is an example:
{
  TCanvas *can = new TCanvas; // create a new canvas

  TF1 *ga = new TF1("ga","pol1+gaus(2)",2,8); // Gaussian on top of a straight line
  ga->SetParameters(10000,1000,10004,5,0.4); // intersection, slope, height, mean, sigma
  ga->SetTitle(); // set plot title to nothing
  ga->GetXaxis()->SetTitle("Energy [keV]"); // set x-axis title
  ga->GetXaxis()->CenterTitle(); // place title to the center of x-axis
  ga->GetYaxis()->SetTitle("Entries/(0.1 keV)"); // set y-axis title
  ga->GetYaxis()->CenterTitle(); // place title to the center of x-axis
  ga->GetYaxis()->SetTitleOffset(1.3); // move title a bit away from y-axis
  ga->SetLineColor(kRed);
  ga->Draw();

  TF1 *li = new TF1("li","pol1",2,8);
  li->SetParameters(10000,1000);
  li->SetLineColor(kBlue);
  li->Draw("same"); // draw in the same canvas (overlap with existing plot)

  TLegend *le = new TLegend(0.2,0.8,0.45,0.95); // (bottom-left x, b-l y, t-r x, t-r y)
  le->AddEntry(ga,"signal","l");
  le->AddEntry(li,"background","l");
  le->Draw(); // draw legend to the same canvas

  can->Print("heap.png"); // save finished plot to a file
}
The final result is shown on the top of this post.
Activities mentions in this site have been supported by the following grants: